April 17, 2026
€50,000 in extra revenue per season from hard-to-sell tickets
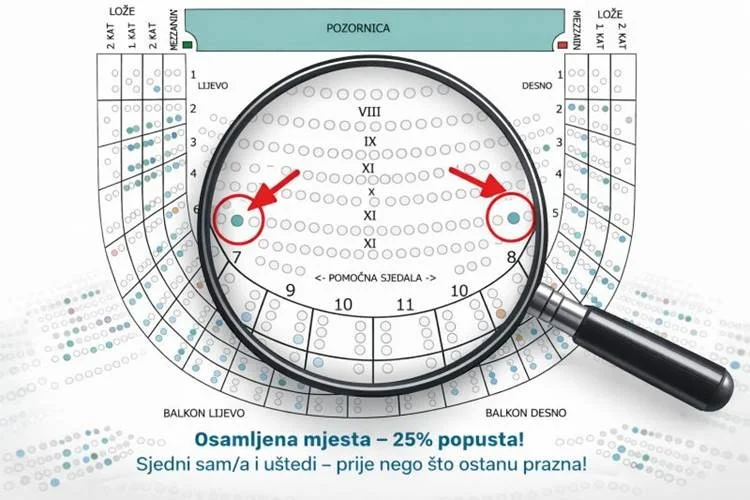
The same scene plays out in every theatre: the hall is "almost sold out", yet here and there individual seats remain — lonely chairs stranded between sold ones. They are hard to sell because audiences mostly arrive as couples or in groups. And the cost is not only the revenue lost on those unsold tickets. Empty seats visually damage the impression of a full house, sap the energy of the performers and erode the perceived success of the show.
How much should you discount?
The question is: how deep a discount do these single seats need in order to move — 10 %, 30 %, 50 %? Too small and nobody notices. Too large and both revenue and the perceived value of the production take a hit.
Put numbers on the problem
Take a 500-seat theatre with an average ticket price of €20. Say the average fill rate is 90 %. That sounds excellent. Except that 10 % empty means 50 seats per performance. Most of them are single seats left "trapped" between the sold ones.
The financial picture of that situation is the following. 50 unsold seats × €20 = €1,000 of lost revenue per performance. A professional theatre running 100 performances a year is looking at €1,000 × 100 = €100,000 annually. This is not merely an aesthetic problem. It is very real money.
Gut feel is not a pricing strategy
Most theatres set discounts by feel: "Let us try 20 % and see." Fine, but without systematic data tracking it is impossible to know how many single seats remained unsold, at what stage of the sales cycle they appear, which price tiers are most problematic, or whether the audience responds to 15 % the same way it responds to 35 %. Without analytics, every decision is a guess.
What a BI system actually does here
With a proper BI system a theatre can analyse the sales dynamic at the seat level — seeing precisely when single seats start getting stranded between sold ones. It can also test different discount levels, for example: week 1 at 15 % off single seats, week 2 at 25 %, week 3 at 35 %. In that experiment the BI system measures conversion rate, sales velocity, impact on total revenue, the cannibalisation effect on regular sales and so on.
Data beats opinion
The theatre in this example introduced data tracking, and the results after three months were the following: 15 % off produced almost no effect; at 25 % off, 40 % of the single seats were sold; at 35 % off, 75 % were sold. Anything beyond 35 % did not bring meaningful additional growth. The optimal discount is therefore 35 %.
That is a data point. It is not an opinion. Nor a feeling.
The bottom line
The optimisation meaningfully changes the financial picture. Out of 50 single seats, 75 % sell — that is 37.5 seats. A ticket discounted by 35 % costs €13, which delivers 37.5 × €13 = €487.50 of additional revenue per performance. Annualised across 100 performances, that is €487.50 × 100 = €48,750 in extra revenue per theatre season.
No extra performances. No price increases. No higher production costs. Just smarter data management. Wooow!
Related stories
Ready for the next step?